This ongoing project merges together two interests I have as a design scholar. First, a creative and experimental engagement with data visualization, in this case, of archival documents. And second, an ongoing question on how a Hispanic identity has been part of the United States since long before the massive immigration of the last decades. In this project I create a visual interface to explore the maps included in the “Spanish Land Grants” collection. In the process I investigate techniques for presenting large image collections with an open and experimental approach.
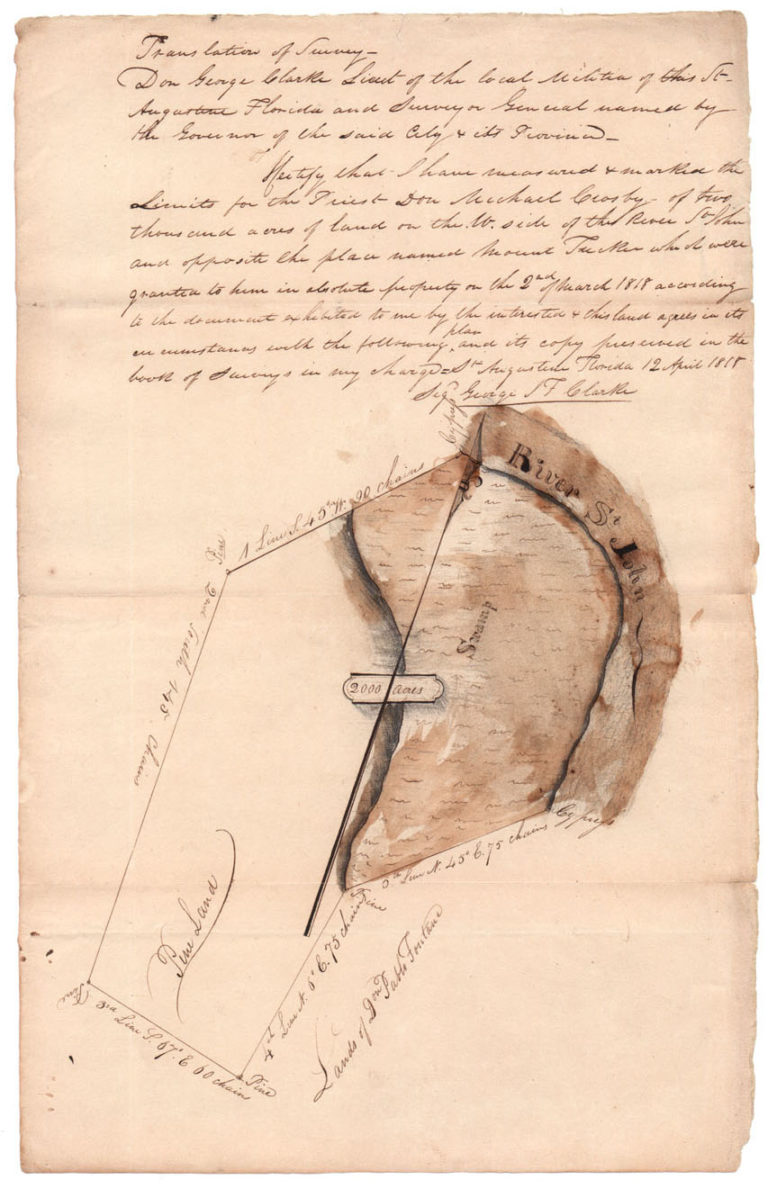
The state of Florida is marked by a historical layer of the Spanish possession that ceased in 1821.The maps used in this project correspond to plats drawn in the eighteen twenties by landowners to represent the material qualities of the lands in an effort to prove ownership after Spain ceded the territory of Florida to the United States. The selection of maps presented in this collection contain labels written in Spanish that are documental traces of the Hispanic history of the state. The maps offer a glimpse into the visual representations of these fragments of land and the english translations symbolize the period of transition.
Objectives and deliverables
– Explore methods and techniques to present interactive image collections
– Create image plots of the images to reveal patterns
– Create an interactive visualization to navigate the set of images
– Write an essay/paper about the findings.
Outline of Workflow (in progress)
Collect images from the digital archive
My initial idea is to focus on the documents in the collection that contain maps in spanish and their english translations. I am going to start with a a initial amount of images to test ideas. My plan is to create a workflow that allows me to include more images later when the interface is resolved.
Research and experimentation
How the project will evolve is also dependent on this stage. I’ll experiment with different tools like ImageJ, to understand better the collection and reveal patterns. I’ll look into web frameworks to visualize image galleries (HTML5, JavaScript and AngularJS).

First test of an image plot using ImageJ